British Columbia. Canadian Brewing Province of the Decade?
The nominations are in. And the winner is: British Columbia, as the Canadian brewing industry’s Province of the Decade.
– A lone voice behind the podium after the doors close on CBAC 2018
* Updated to add 2019!
——————————–
Every year, Canadian brewing industry folks gather for the Canadian Brewing Awards & Conference (CBAC), presented by the TAPS Media group. The most recent instance was held this past weekend in Halifax NS. During the climactic awards gala, it was revealed that, once again, BC came away with a haul of awards that is disproportionate to our province’s size. Also, yet again, one of our locals took home Brewery of the Year (Burnaby’s Dageraad Brewing; congrats to a deserving brewery!).
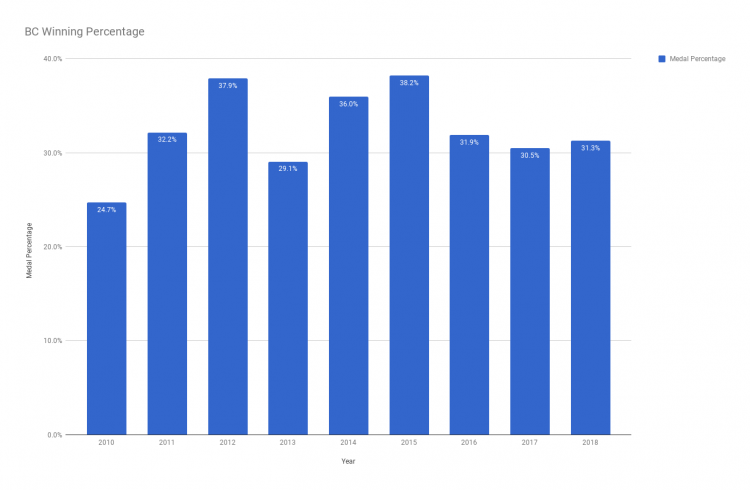
Back in 2012, after Central City Brewing won CBAC Brewery of the Year for the second time and BC took home almost 38% of the medals, a writer named Derek Hyde broached the question as to whether BC’s dominance had peaked. Well, as it turned out, BC would push its record even farther by exceeding 38% of the medal count in 2015–and would continue on a tear that has produced a top spot result (best Beer or Brewery) nine years in a row and counting. That’s a streak that even LeBron James can’t match.
Of course, there’s no category or award for Province of the Year, or Province of the Decade. It’s patently un-Canadian to flat out brag about all the award bling, and we’re not technically in competition with Ontario or any other province for anything. But if we were, you’d have to like our chances. Plus, as a BC craft beer journal we have an obligation to point out when our hard-working beer heroes are succeeding at their calling, and come on, if you don’t like the idea of beating Easterners at stuff, you’re just not a Westerner.
How long has BC been kicking butt?
This year marks the 16th Annual CBAC, so the awards have been around for most of this century (in early years held primarily in Central Canada, where TAPS is based). Of course BC has done reasonably well all along. But it’s in the current decade that we see a sustained period of excellence that really bears noting.
Consider this: every year this decade, a BC brewery has won either Brewery of the Year or Beer of Year (ie, Best In Show). That goes from 2010 until right now. No other province can claim that (dead easy to verify because BC is the only province this decade to “sweep”; Central City took both top honours in 2010, shutting the rest of Canada out and getting the Decade of Dominance off to a fast start.
| Year | Awards Location | Brewery Of The Year | Best Of Show/Beer Of The Year |
| 2010 | Etobicoke ON | Central City | Central City Thor’s Hammer |
| 2011 | Toronto ON | Driftwood Fat Tug IPA | |
| 2012 | Montreal QC | Central City | |
| 2013 | Victoria BC | Powell Street Old Jalopy | |
| 2014 | Fredericton NB | Old Yale Sasquatch Stout | |
| 2015 | Niagara Falls ON | Four Winds | |
| 2016 | Richmond BC | Four Winds Nectarous | |
| 2017 | Ottawa ON | Mt. Begbie | |
| 2018 | Halifax NS | Dageraad | |
| 2019 | Toronto ON | Central City/Red Racer After Hours Pale Ale |
For reasons we’ll mention momentarily, it’s probably not fair to compare BC’s performance against some of the other provinces’. But it really is stunning how well BC does year in, year out.
Exactly how well, proportionally? There’s never been an analysis to prove exactly HOW much ass we’re kicking. So after pondering on this we decided to turn what was just a hunch into cold hard statistics.
Precisely how much butt does British Columbia kick?

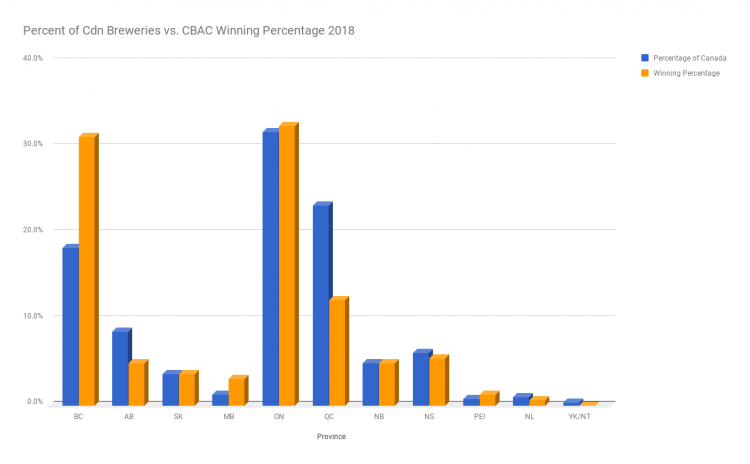
BC currently has approximately 150 out of 820 breweries in Canada. That’s less than 20% of all breweries; however, we regularly win at a rate over 30%.

Ontario has ~31% of the breweries in Canada, and won ~31% of the 2018 medals. BC more or less tied Ontario for most awards, despite having only 58% the number of breweries Ontario has to work with.

Ever since the number of categories was expanded from around 40 to 55 a couple of years ago in Richmond, BC has averaged 50 medals per year, and 31% of medals overall. Impressive as that is, those aren’t BC’s best years. The most gaudy numbers were attained in 2012, 2014 and 2015, when BC won more than one medal per beer category, on average.

The chart below makes it pretty clear which provinces are the source of BC’s surplus winning percentage. However this sample is for just one year, and it’s not fair to categorize certain provinces as having a weaker beer scene. To some extent, their scene is just different, especially Quebec’s.

La Belle Province has long had a distinctive brewing scene, but some would say its breweries have core strengths in certain styles. In order to do well in total number of medals won, it’s necessary to excel in a very wide range of styles. There’s no question that BC’s breweries can claim to be good at everything from English to Belgian to West Coast styles, and that type of flexibility is one key to what makes BC punch above its weight year after year.
As for our neighbours in Alberta: legislative changes this decade are starting to move them in the direction that BC has slowly been going, and their craft beer scene has its eye on catching up to ours in quality. So we can expect more great things from them in the near future.
Note: Cider, a sideline at CBAC in recent years, has been kept out of this calculation. Not because it’s not good enough to be counted along with the beer, but as it turns out, because it’s good enough to get its own awards ceremony starting this year; yay cider, and well done TAPS.
Now: don’t blame What’s Brewing if the BC winning streak ends here. We’re confident that the good folks at CBAC will forget all about this little bit of horn-blowing by next year. 😊
———————
For the auditors and data nerds
| Year | 2010 | 2011 | 2012 | 2013 | 2014 | 2015 | 2016 | 2017 | 2018 | 2019 |
| Number of Categories | 31 | 39 | 39 | 39 | 38 | 41 | 55 | 55 | 55 | 55 |
| Total Medals Awarded | 93 | 115 | 116 | 117 | 114 | 123 | 163 | 164 | 163 | 164 |
| Total BC Medals | 23 | 37 | 44 | 34 | 41 | 47 | 52 | 50 | 51 | 49 |
| Sweeps* | 0 | 2 | 3 | 1 | 3 | 2 | 2 | 3 | 1 | 2 |
| Medal Percentage | 24.7% | 32.2% | 37.9% | 29.1% | 36.0% | 38.2% | 31.9% | 30.5% | 31.3% | 29.7% |
| Wins per Category | 0.74 | 0.95 | 1.13 | 0.87 | 1.08 | 1.15 | 0.95 | 0.91 | 0.93 | 0.89 |
| Cider | 1/12 | 4/12 | 4/17 |
* Number of categories BC won all three medals in (Gold/Silver/Bronze).
Sources
- http://www.canadianbeernews.com/2010/09/24/canadian-brewing-awards-2010/
- http://www.canadianbeernews.com/2011/09/10/canadian-brewing-awards-2011-winners/
- https://www.canadianbrewingawards.com/winners/2012-winners-list/
- https://www.canadianbrewingawards.com/winners/2013-winners-list/
- https://www.canadianbrewingawards.com/winners/2014-winners-list/
- https://www.canadianbrewingawards.com/winners/2015-winner-list/
- https://www.canadianbrewingawards.com/winners/2016-winner-list/
- https://www.canadianbrewingawards.com/2017-winner-list/
- https://www.canadianbrewingawards.com/2018-winners/
- https://www.canadianbrewingawards.com/2019-winners/
- https://industry.beercanada.com/national-overview
This Post Has 0 Comments